


Criminology and Criminal Justice Examples
Example 1
Caption
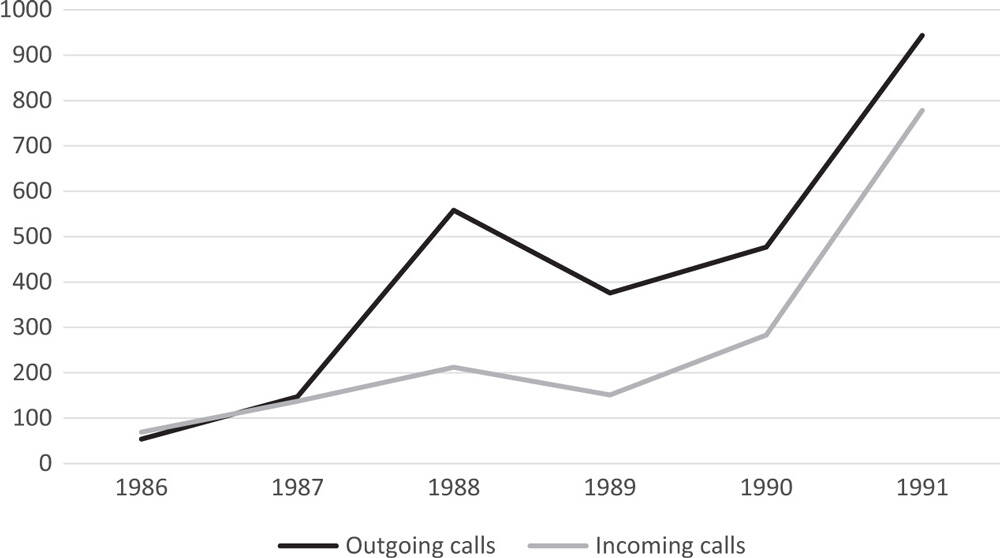
Figure 4.1 Victim Support Södertälje’s outgoing and incoming calls from 1986 to 1991.
Alt Text
Starting in 1986, outgoing calls and incoming calls both register at 50 and remain bound in 1987 at 100, in 1988 outgoing calls spikes to 550 while incoming calls rises to 200, 1989 outgoing calls drops to 400 while incoming calls drops to 175, in 1990 both rise with outgoing calls at 480 and incoming calls at 290, finally in 1991 both rise with outgoing calls reaching 950 and incoming calls reaching 790.
Source [Open Access]
Gallo, C., and Svensson, K. (2019). Victim Support and the Welfare State (1st ed.). Routledge. https://doi.org/10.4324/9780429505744
Example 2

Caption
Figure 4.2 Trygg Hansa’s logotype.
Alt Text
Logo: Trygg Hansa.
Source [Open Access]
Gallo, C., and Svensson, K. (2019). Victim Support and the Welfare State (1st ed.). Routledge. https://doi.org/10.4324/9780429505744
Example 3

Caption
Figure 4.3 BOJ’s logotype.
Alt Text
Logo: BOJ - Brottsofferjourernas Riksförbund.
Source [Open Access]
Gallo, C., and Svensson, K. (2019). Victim Support and the Welfare State (1st ed.). Routledge. https://doi.org/10.4324/9780429505744
Example 4
Caption
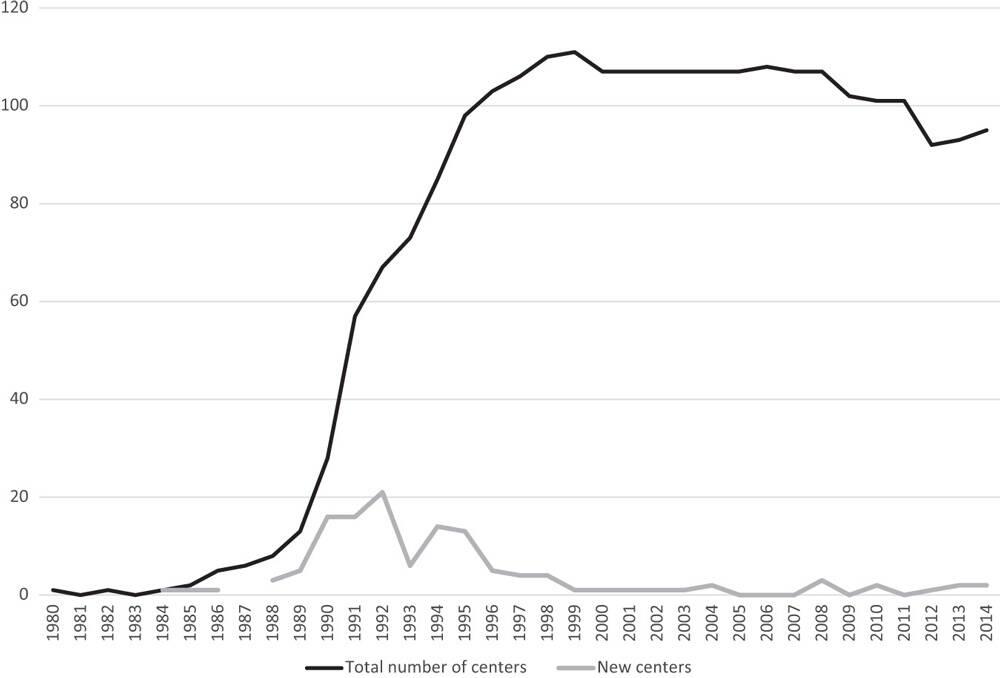
Figure 5.1 Growth of local BOJ victim support centers from 1980 to 2014.
Alt Text
Starting in 1980 and going through 2014 the Total number of centers starts at 1 and remains low until 1988 when it starts to rise, dramatically between 1989 and 2000 topping out at 150 before going flat then declining starting in 2008 and reaching 75 in 2011, before rising slightly ending in 2014 at 90. New centers start in 1984 and has a sharp rise starting in 1988 to 1992 reaching 21 before declining to no more than three until 2014.
Long Description
Values are estimates rounded to an integer value based on the visible graph chart.
| Year | New Centers | Total Number of Centers |
|---|---|---|
| 1980 | No Data | 1 |
| 1981 | No Data | 0 |
| 1982 | No Data | 1 |
| 1983 | No Data | 0 |
| 1984 | 1 | 1 |
| 1985 | 1 | 2 |
| 1986 | 1 | 5 |
| 1987 | No Data | 6 |
| 1988 | 4 | 8 |
| 1989 | 5 | 13 |
| 1990 | 15 | 25 |
| 1991 | 15 | 60 |
| 1992 | 21 | 70 |
| 1993 | 6 | 75 |
| 1994 | 14 | 88 |
| 1995 | 12 | 98 |
| 1996 | 5 | 104 |
| 1997 | 4 | 106 |
| 1998 | 4 | 110 |
| 1999 | 1 | 111 |
| 2000 | 1 | 106 |
| 2001 | 1 | 106 |
| 2002 | 1 | 106 |
| 2003 | 1 | 106 |
| 2004 | 3 | 106 |
| 2005 | 0 | 106 |
| 2006 | 0 | 107 |
| 2007 | 0 | 106 |
| 2008 | 4 | 105 |
| 2009 | 0 | 103 |
| 2010 | 2 | 101 |
| 2011 | 0 | 101 |
| 2012 | 1 | 93 |
| 2013 | 2 | 94 |
| 2014 | 2 | 95 |
Source [Open Access]
Gallo, C., and Svensson, K. (2019). Victim Support and the Welfare State (1st ed.). Routledge. https://doi.org/10.4324/9780429505744
Example 5
Caption
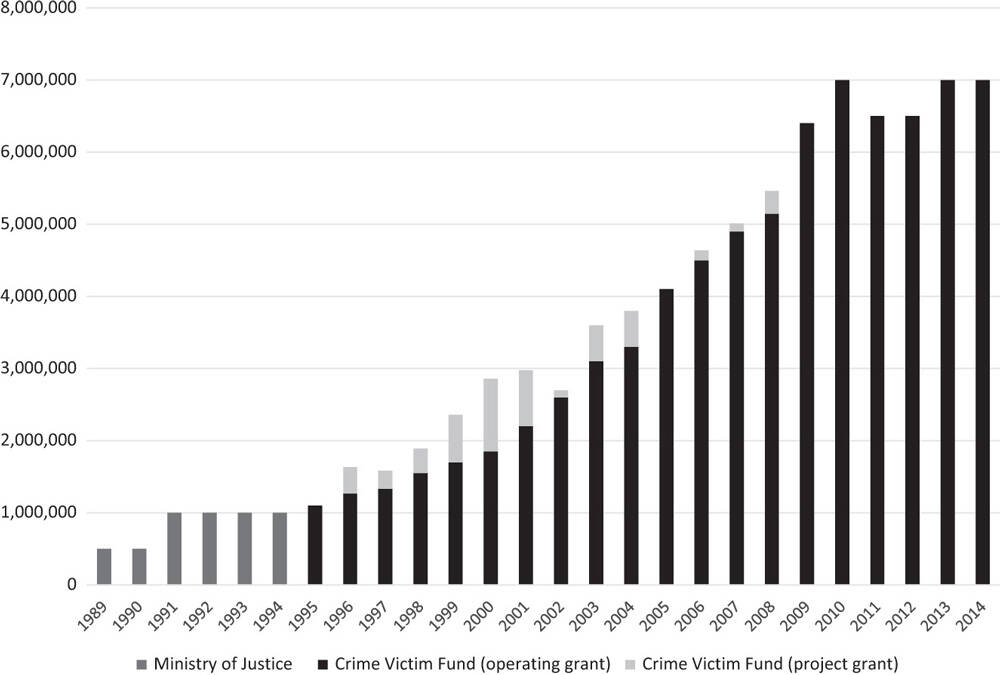
Figure 5.2 The Ministry of Justice and the Crime Victim Fund grants to BOJ (SEK).
Alt Text
Starting in 1989 with the Ministry of Justing values never top one million until 1995 when the Crime Victim Fund (operating grant) starts, this steadily increase, with occasional boosts from Crime Victim Fund (project grant) entries through 2010 when it reaches seven million, 2011 and 2012 show a slight drop to six and a half million, before returning to seven million in 2013 and 2014.
Long Description
The intention of the chart seems to indicate a base value with extra values on top, each year is listed listed this way with a total value described.
All numbers are estimates given the vertical index is in increments of one million.
-
1989
Ministry of Justice at 500,000
-
1990
Ministry of Justice at 500,000
-
1991
Ministry of Justice at 1,000,000
-
1992
Ministry of Justice at 1,000,000
-
1993
Ministry of Justice at 1,000,000
-
1994
Ministry of Justice at 1,000,000
-
1995
Crime Victim Fund (operating grant) at 1,100,000
-
1996
Crime Victim Fund (operating grant) at 1,300,000
Crime Victim Fund (project grant) at 300,000
total value at 1,600,000
-
1997
Crime Victim Fund (operating grant) at 1,350,000
Crime Victim Fund (project grant) at 150,000
total value at 1,500,000
-
1998
Crime Victim Fund (operating grant) at 1,600,000
Crime Victim Fund (project grant) at 300,000
total value at 1,900,000
-
1999
Crime Victim Fund (operating grant) at 1,700,000
Crime Victim Fund (project grant) at 500,000
total value at 2,200,000
-
2000
Crime Victim Fund (operating grant) at 1,800,000
Crime Victim Fund (project grant) at 1,000,000
total value at 2,800,000
-
2001
Crime Victim Fund (operating grant) at 2,200,000
Crime Victim Fund (project grant) at 750,000
total value at 2,950,000
-
2002
Crime Victim Fund (operating grant) at 2,600,000
Crime Victim Fund (project grant) at 100,000
total value at 2,700,000
-
2003
Crime Victim Fund (operating grant) at 3,050,000
Crime Victim Fund (project grant) at 550,000
total value at 3,600,000
-
2004
Crime Victim Fund (operating grant) at 3,300,000
Crime Victim Fund (project grant) at 500,000
total value at 3,800,000
-
2005
Crime Victim Fund (operating grant) at 4,050,000
total value at 4,050,000
-
2006
Crime Victim Fund (operating grant) at 4,500,000
Crime Victim Fund (project grant) at 100,000
total value at 4,600,000
-
2007
Crime Victim Fund (operating grant) at 4,900,000
Crime Victim Fund (project grant) at 100,000
total value at 5,000,000
-
2008
Crime Victim Fund (operating grant) at 5,200,000
Crime Victim Fund (project grant) at 300,000
total value at 5,500,000
-
2009
Crime Victim Fund (operating grant) at 6,400,000
total value at 6,400,000
-
2010
Crime Victim Fund (operating grant) at 7,000,000
total value at 7,000,000
-
2011
Crime Victim Fund (operating grant) at 6,500,000
total value at 6,500,000
-
2012
Crime Victim Fund (operating grant) at 6,500,000
total value at 6,500,000
-
2013
Crime Victim Fund (operating grant) at 7,000,000
total value at 7,000,000
-
2014
Crime Victim Fund (operating grant) at 7,000,000
total value at 7,000,000
Source [Open Access]
Gallo, C., and Svensson, K. (2019). Victim Support and the Welfare State (1st ed.). Routledge. https://doi.org/10.4324/9780429505744
Example 6

Caption
Figure 7.1 SoS’s grants to BOJ for its work with violence against women from 2004 to 2014 (SEK).
Alt Text
Starting at 200,000 in 2004 there is a gradual rise to 350,000 in 2007 before dropping to 150,000 in 2008, a dramatic increase to 625,000 in 2009, a steady rate at 800,000 for 2010 to 2013, and a final rise to 1,000,000 in 2014.
Source [Open Access]
Gallo, C., and Svensson, K. (2019). Victim Support and the Welfare State (1st ed.). Routledge. https://doi.org/10.4324/9780429505744