


Law Examples
Example 1
Caption
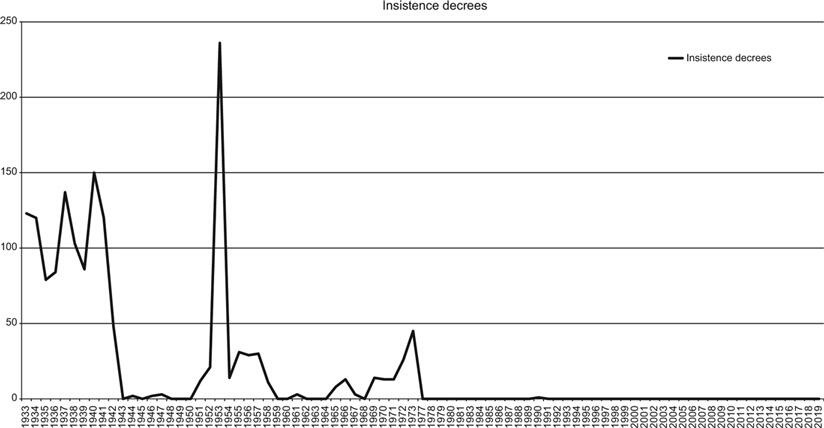
Figure 7.1 Insistence decrees, 1933–2019
Alt Text
Titled Insistence decrees, starting at one hundred twenty-five in nineteen thirty-three it grows with regular spikes to one hundred fifty in nineteen forty, before dropping to less than 10 until nineteen fifty when it spikes to two hundred forty in nineteen fifty-three, dropping to thirty from nineteen fifty-four to nineteen fifty-eight, then dropping to less than fifteen until a spike of forty-five in nineteen seventy-three, then dropping to zero until twenty-nineteen.
Source [Open Access]
Mikuli, P., and Kuca, G. (Eds.). (2021). Accountability and the Law: Rights, Authority and Transparency of Public Power (1st ed.). Routledge. https://doi.org/10.4324/9781003168331
Example 2
Caption
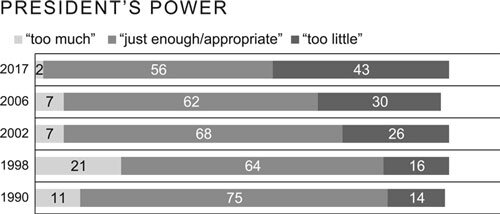
Figure 8.1 Public evaluation of the powers of the president in Finland, 1990–2017, in percentage Source: Arvo-ja asennetutkimus/EVA Attitude and Value Survey (2018).
Alt Text
Titled President's Power, with categories of 'too much' and 'just enough/appropriate' and 'too little'. A trend from 1990 to 2017 shows 'too little' is rapidly growing from fourteen percent in 1990 to forty-three percent in 2017 while 'just enough/appropriate' drops from 75 percent in 1990 to fifty-six percent in 2017.
Long Description
| Year | Too Much | Just Enough/Appropriate | Not Enough |
|---|---|---|---|
| 2017 | 2 | 56 | 43 |
| 2006 | 7 | 62 | 30 |
| 2002 | 7 | 68 | 26 |
| 1998 | 21 | 64 | 16 |
| 1990 | 11 | 75 | 14 |
Source [Permission]
Arvo-ja asennetutkimus/EVA Attitude and Value Survey (2018).
Example 3
Caption
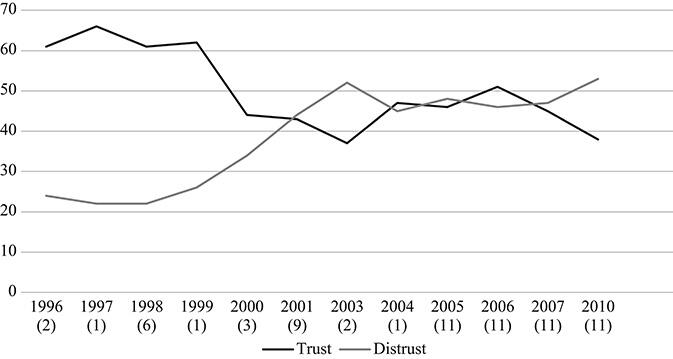
Figure 10.1 (Dis)trust in the SCC as a political institution 1996–2010. Numbers in brackets indicate the month of the data collection.
Alt Text
Trust and Distrust comparisons from 1996 to 2010; distrust starts at 25 percent and gradually increases to 52 percent in 2003, dropping slightly before ending at 53 percent in 2010. Trust starts at 61 percent, rises to 65 percent in 1997, then drops in steps to 38 percent in 2003 before rising and remaining roughly equal to distrust around 45 percent, before ending 2010 at 38 percent.
Long Description
Values are whole number estimates taken from visible graph chart since original values are unavailable.
| Trust | Distrust | Month | |
|---|---|---|---|
| 1996 | 61 | 24 | 2 |
| 1997 | 65 | 22 | 1 |
| 1998 | 61 | 22 | 6 |
| 1999 | 62 | 26 | 1 |
| 2000 | 45 | 35 | 3 |
| 2001 | 43 | 43 | 9 |
| 2003 | 38 | 52 | 2 |
| 2004 | 48 | 45 | 1 |
| 2005 | 47 | 48 | 11 |
| 2006 | 51 | 46 | 11 |
| 2007 | 45 | 47 | 11 |
| 2010 | 39 | 52 | 11 |
Source [Open Access]
Florczak-Wątor, M. (Ed.). (2020). Judicial Law-Making in European Constitutional Courts (1st ed.). Routledge. https://doi.org/10.4324/9781003022442